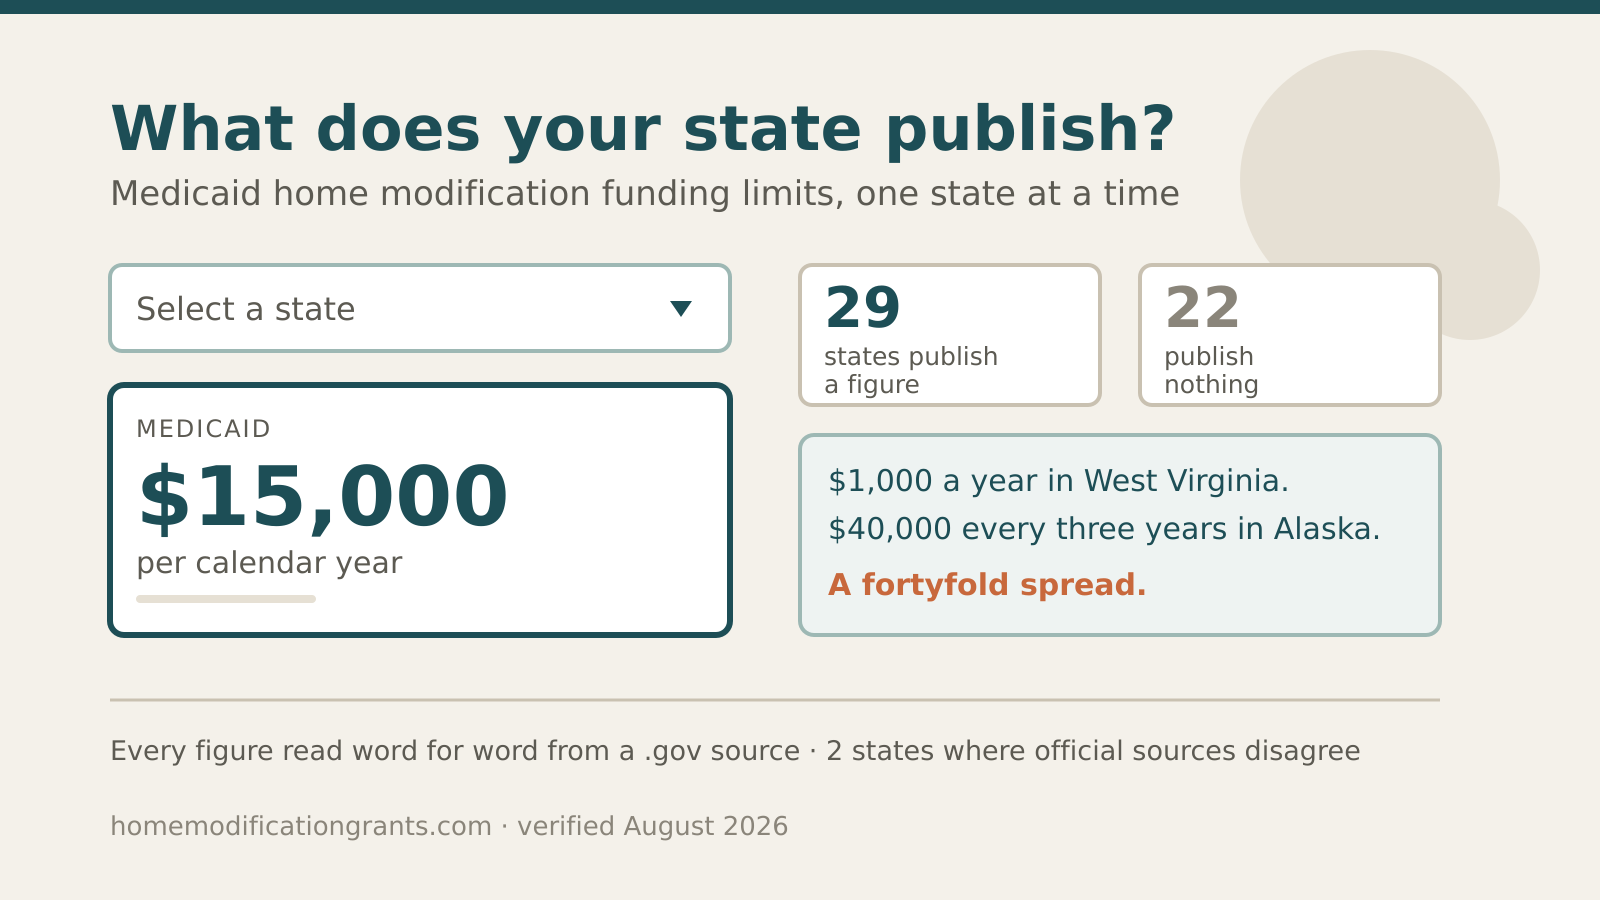
Pick your state and we will show you what it actually publishes — the program name, the dollar ceiling, the period that ceiling covers, and, where the state publishes nothing, an honest account of what kind of nothing it is. No estimates, no averages, no numbers borrowed from another state.
Medicaid home modification money is set state by state, and the spread is wider than almost anyone expects — from $1,000 a year to $40,000 every three years. Roughly two in five states publish no figure at all.
Tick everything that applies. This only decides which programs we show you — nothing is submitted, and we do not ask for anything identifying.
- 29 states publish a figure. Those are quoted with the period they cover, because a $15,000 annual cap and a $15,000 lifetime cap are not the same benefit.
- 22 do not. Rather than fill the gap with someone else’s number, we tell you which kind of gap it is — a deliberate policy choice, a genuine absence, or a document we could not open — and what to ask for.
- 2 states have official sources that contradict each other. We publish both figures and say so.
Full sourcing rules: how we source our data. Every figure here traces to the 50-state table, which carries the primary-source link for each state. Last verified 2026-08-19. Spotted something out of date? Tell us and we will correct it.
Why a tool instead of another article
Almost every page that ranks for this question answers it with a national average. There is no such thing. West Virginia publishes $1,000 per service year. Alaska publishes $40,000 every three years. That is a fortyfold spread for what is nominally the same federal benefit, and an average across it is worse than no answer — it is a wrong answer delivered with confidence.
The second problem is the period. A $15,000 annual cap and a $15,000 lifetime cap look identical in a table and are completely different benefits. Ohio’s $15,000 resets every calendar year. New Hampshire’s $15,000 is once, for life. Utah’s $5,000 is per service occurrence, and Oregon’s is per project. Any tool that flattens those into one column is misleading you.
So this one does not flatten them. It gives you one state at a time, with the period attached, the caveats attached, and a link to the primary source behind it.
The four periods, and why they decide what you can actually build
Every published ceiling in the country attaches to one of four periods. Before you plan anything, find out which one your state uses, because it changes the arithmetic completely.
- Per year. The best case. The money comes back. Ohio’s $15,000 resets every calendar year, Virginia’s $5,000 resets every calendar year, Iowa publishes $7,154.64 a year. If you need a ramp now and a bathroom in three years, an annual state gives you two full budgets.
- Lifetime. One shot. Texas publishes $7,500 for life, New Hampshire $15,000 for life, Wyoming $20,000 for life. In a lifetime state the sequencing question matters enormously: spending $6,000 on a stairlift at 68 may leave you unable to fund a roll-in shower at 78.
- Per project. Oregon’s $5,000 is per project, not per year and not per lifetime. On paper this is generous. In practice it puts the weight on how the state defines a project, which is the thing to ask about before you scope the work.
- Per occurrence or per service. Utah’s $5,000 is a maximum payment per service. Washington publishes $700 per occurrence, with a separate $4,000 for ramp construction. These numbers look small next to a lifetime cap and are not directly comparable to one.
Two further wrinkles that a single number will never show you. First, several ceilings are combined budgets: Illinois’ $25,000 over five years is shared with assistive equipment, Maryland’s $15,000 is shared with assistive technology, Kansas’ $10,000 is shared with vehicle modifications and medical equipment, and North Carolina’s $28,000 is shared with equipment and technology. A power wheelchair can consume the money you were counting on for a ramp. Second, a few ceilings are counted per household rather than per person — Wyoming’s $20,000 is one budget for the home, not one each for two eligible residents.
The tool flags all of these on the state you pick, because they are exactly the details that go missing when a figure is copied from site to site.
“Not published” is three different problems
Twenty-two states publish no dollar figure. Most pages that cover this topic either invent one or quietly skip those states. Neither helps you, because the reason a number is missing changes what you should do next.
Some states deliberately use another mechanism. North Dakota sets the limit by formula — the lesser of the highest monthly rate for the costliest skilled nursing facility, or 20% of the home’s tax evaluation. Arkansas writes the service out of the budget cap entirely. Michigan sets no dollar limit but forbids work that lifts the home’s value significantly above comparable neighbourhood properties. Pennsylvania caps other services in the same document and pointedly does not cap this one. In these states there is nothing missing: asking “what is the limit” is the wrong question, and the right one is “what test do you apply instead.”
Some genuinely have no number anywhere we can reach. Connecticut, Georgia, Mississippi, Montana, Nebraska, Rhode Island, South Dakota and Vermont fall here. The practical move is to ask your care manager for the current service definition in writing rather than to assume either generosity or stinginess.
And some have a number we simply cannot read. Nevada’s Medicaid Services Manual chapter is blocked by robots.txt. Maine publishes the authoritative text only as a .docx. Idaho’s rule is a PDF too large to render past its contents page. Oklahoma, Massachusetts and Hawaii distribute the relevant appendix as a ZIP archive. A figure probably exists in all six; we will not guess at it, and we tell you exactly which door was locked so you can knock on it yourself.
Two states where the official sources contradict each other
New Mexico is the starkest disagreement we found anywhere. The state administrative code gives $5,000 per five years. The Health Care Authority’s own managed care policy manual, effective 2024-07-01, gives $65,000 per five years. Both are official. They differ by thirteen times. We publish both figures side by side rather than pick the one that reads better, and we suggest asking HCA in writing which governs your case — the answer is worth $60,000.
South Carolina is a subtler trap. The widely repeated $7,500 lifetime figure traces back to a 2017 manual. The current CLTC manual, issued 2023-12-08, does not restate a home modification cap at all — the $7,500 that appears in it refers to vehicle modifications. Anyone quoting $7,500 for South Carolina home modifications today is quoting a nine-year-old document, possibly about the wrong service. The tool says so on the South Carolina result.
What to say once you have your state’s number
The figure is leverage, not a decision. Across every state we have examined, four things hold consistently enough to plan around.
- Prior authorization is universal. We have not found a single state that reimburses work started before approval. Get the authorisation in writing before a contractor orders materials.
- Published caps are more often soft than people assume. New York states outright that “service limits are soft limits that may be exceeded due to medical necessity.” Texas lets the health plan exceed the cap without state approval. New Jersey lets the MCO exceed it in specific circumstances. Washington has a formal Exception to Rule. If the quote comes in over the ceiling, the first move is to have medical necessity documented — not to cut the scope.
- “General utility” is the universal exclusion. Every state we checked refuses work that benefits the house rather than the person, and refuses square footage. Roof repair, carpeting and central air conditioning are named exclusions again and again. Frame the request around a specific daily activity you cannot perform, not around the house.
- Renting is allowed nearly everywhere, with the landlord’s written consent obtained first. Ask early who pays to restore the property when you leave, because several states fund the modification and explicitly not its removal.
What the tool will not do
It will not tell you whether you personally qualify — that decision is made by a state assessment and a care plan, and anyone claiming to shortcut it online is guessing. It will not quote you a price for the work; that is a contractor’s job. And it will not fill a gap with a number we could not verify. For 22 states the honest answer is that no figure is published, and the tool says so instead of inventing one.
What it does do is put you in front of a care manager or a county office already knowing what your state has written down — which is the single biggest predictor of whether a request gets approved at the amount you actually need.
Where these numbers come from
This tool is a front end for our 50-state Medicaid home modification funding limits table, which carries 102 primary-source links — one for each state’s figure and one for each state’s note. Nothing appears in the tool that is not in that table, and nothing is in that table that we did not read word for word from a .gov source.
For the underlying question of what Medicaid covers anywhere, start with does Medicaid pay for home modifications. If Medicaid is not your route, our overview of home modification grants covers the programs that sit outside it. Full state pages are published for Texas, New York and California and Ohio, with more added each week.
Our sourcing rules are set out in full in how we source our data. Last verified 2026-08-19.
Frequently asked questions
Does this tell me whether I qualify?
No, and be sceptical of anything that claims to. Eligibility turns on a functional assessment and an approved care plan, both carried out by your state. What this tool does is tell you what your state has committed to in writing, so you walk into that process knowing the number rather than learning it afterwards.
Why does my state show no amount when other websites quote one?
Because we could not read that amount in a state Medicaid document, a state administrative code or a medicaid.gov file. Figures circulating on commercial senior-care sites are frequently copied from old manuals, borrowed from a neighbouring state, or refer to a different service — South Carolina’s widely quoted $7,500 is a 2017 number that the current manual applies to vehicle modifications. We would rather show you a gap than a number we cannot stand behind.
Can I use more than one program at once?
Often, yes. Medicaid and the VA HISA grant are separate systems and holding both is normal. Non-Medicaid housing grants are administered by different agencies with their own budgets. Note though that several Medicaid programs are explicitly payers of last resort and require you to explore other sources first — so checking the alternatives is usually a step in the Medicaid process rather than an alternative to it.
How often are these figures rechecked?
On a rolling schedule, and sooner where we know a change is coming — Minnesota’s rate rises on 2026-01-01, and North Carolina’s $28,000 is tied to a waiver cycle that ends 2029-10-31. Every state row carries the date it was last read. If you pick a state in the tool you can ask us to email you when that state’s number moves.
Knowing your state’s ceiling matters most when you are deciding between adapting the home and moving to a facility. That trade-off is worked through in home care vs. memory care: the real 2026 cost math.
Leave a Reply